Customizing Docker Compose
The Docker Compose installation guide explains how to use docker-compose.yml for installing Data Flow, Skipper, Kafka, and MySQL.
You can extend this basic configuration with the help of the provided extension docker-compose files.
For example, if you want to use RabbitMQ or PostgreSQL or enable Data Flow for Monitoring, you can combine some of the provided docker-compose extension files:
docker-compose -f ./docker-compose.yml \
               -f ./docker-compose-rabbitmq.yml \
               -f ./docker-compose-postgres.yml \
-f ./docker-compose-influxdb.yml updocker-compose -f .\docker-compose.yml -f .\docker-compose-rabbitmq.yml -f .\docker-compose-postgres.yml -f .\docker-compose-influxdb.yml upThe following sections offer a detailed description of the provided extension docker-compose files that you can apply on top of the docker-compose.yml. When you use more than one docker-compose file, they are applied in the order of their definition.
Prometheus & Grafana
The docker-compose-prometheus.yml file extends the default configuration in docker-compose.yml to enable the Stream and Task monitoring with Prometheus and Grafana:
wget -O docker-compose-prometheus.yml https://raw.githubusercontent.com/spring-cloud/spring-cloud-dataflow/v2.8.4/src/docker-compose/docker-compose-prometheus.yml
docker-compose -f ./docker-compose.yml -f ./docker-compose-prometheus.yml upcurl https://raw.githubusercontent.com/spring-cloud/spring-cloud-dataflow/v2.8.4/src/docker-compose/docker-compose-prometheus.yml -o docker-compose-prometheus.yml
docker-compose -f .\docker-compose.yml -f .\docker-compose-prometheus.yml upIn addition to the basic services, the extended configuration adds Prometheus and Prometheus-RSocket-Proxy for service-discovery and adds Grafana with pre-built Stream and Task dashboards.
The docker-compose-prometheus.yml configurations expose the following container ports to the host machine:
| Host ports | Container ports | Description |
|---|---|---|
| 9090 | 9090 | Prometheus server port. Use it to reach the Prometheus web console at http://localhost:9090 |
| 3000 | 3000 | Grafana server port. Use it to reach the Grafana dashboard http://localhost:3000 |
| 9096 | 9096 | Prometheus RSocket Proxy (Spring Boot) Server Port |
| 7001 | 7001 | Prometheus RSocket Proxy TCP accept port. You can configure Stream and Task application to use this port to report their metrics to the proxy. |
| 8086 | 8086 | Prometheus RSocket Proxy WebSocket port. You can configure Stream and Task application to use this port to report their metrics to the proxy. |
The docker-compose-prometheus.yml file expects existing Docker images (springcloud/spring-cloud-dataflow-prometheus-local and springcloud/spring-cloud-dataflow-grafana-prometheus) with tags that match the configured DATAFLOW_VERSION value.
InfluxDB & Grafana
The docker-compose-influxdb.yml enables Stream and Task monitoring with InfluxDB and Grafana with pre-built Stream and Task dashboards:
wget -O docker-compose-influxdb.yml https://raw.githubusercontent.com/spring-cloud/spring-cloud-dataflow/v2.8.4/src/docker-compose/docker-compose-influxdb.yml
docker-compose -f ./docker-compose.yml -f ./docker-compose-influxdb.yml upcurl https://raw.githubusercontent.com/spring-cloud/spring-cloud-dataflow/v2.8.4/src/docker-compose/docker-compose-influxdb.yml -o docker-compose-influxdb.yml
docker-compose -f .\docker-compose.yml -f .\docker-compose-influxdb.yml upThe docker-compose-influxdb.yml configurations expose the following container ports to the host machine:
| Host ports | Container ports | Description |
|---|---|---|
| 8086 | 8086 | Influx DB server port. Use http://localhost:8086 to connect to the Influx DB. |
| 3000 | 3000 | Grafana server port. Use it to reach the Grafana dashboard http://localhost:3000. |
The docker-compose-influxdb.yml expects an existing Docker image (springcloud/spring-cloud-dataflow-grafana-influxdb) with a tag that matches the configured DATAFLOW_VERSION value.
Wavefront
The docker-compose-wavefront.yml enables Stream and Task monitoring with Wavefront with pre-built Stream and Task dashboards.
Wavefront is a SaaS offering, and you need to first create a user account and use that account to set the WAVEFRONT_KEY and WAVEFRONT_URI environment variables, as explained later in this section.
wget -O docker-compose-wavefront.yml https://raw.githubusercontent.com/spring-cloud/spring-cloud-dataflow/v2.8.4/src/docker-compose/docker-compose-wavefront.yml
docker-compose -f ./docker-compose.yml -f ./docker-compose-wavefront.yml upcurl https://raw.githubusercontent.com/spring-cloud/spring-cloud-dataflow/v2.8.4/src/docker-compose/docker-compose-wavefront.yml -o docker-compose-wavefront.yml
docker-compose -f .\docker-compose.yml -f .\docker-compose-wavefront.yml upYou can use the following environment variables to configure the docker-compose-wavefront.yml:
| Variable name | Default value | Description |
|---|---|---|
WAVEFRONT_KEY |
(required) | Wavefront user API Key |
WAVEFRONT_URI |
https://vmware.wavefront.com | Wavefront entry point URI |
WAVEFRONT_SOURCE |
scdf-docker-compose | Unique identifier for Wavefront for the metrics coming from this Data Flow installation. |
You can use the Wavefront's Browse/Source menu to find the metrics coming from the WAVEFRONT_SOURCE source.
Zipkin Server
The docker-compose-zipkin.yml enables Stream distributed trace collection and visualization with Zipkin Server. Open the Zipkin's UI at http://localhost:9411/zipkin to find the distributed traces collected from deployed streaming applications.
All Spring Cloud Stream Applications are pre-configured with Spring Cloud Sleuth to support message distributed tracing. The traced information is sent to an external systems to visualize latency. Spring Cloud Sleuth supports OpenZipkin compatible systems such as Zipkin Server or the Wavefront Distributed Tracing.
The Zipkin distributed tracing is disabled by default. Use the spring sleuth properties to alter the default behavior. For example the docker-compose-zipkin.yaml leverages the SCDF common streaming properties to set the spring.zipkin.enabled=true and spring.zipkin.base-url=http://zipkin-server:9411 for deployed stream applications.
wget -O docker-compose-zipkin.yml https://raw.githubusercontent.com/spring-cloud/spring-cloud-dataflow/v2.8.4/src/docker-compose/docker-compose-zipkin.yml
docker-compose -f ./docker-compose.yml -f ./docker-compose-zipkin.yml upcurl https://raw.githubusercontent.com/spring-cloud/spring-cloud-dataflow/v2.8.4/src/docker-compose/docker-compose-zipkin.yml -o docker-compose-zipkin.yml
docker-compose -f .\docker-compose.yml -f .\docker-compose-zipkin.yml upThe docker-compose-zipkin.yml configurations expose the following container ports to the host machine:
| Host ports | Container ports | Description |
|---|---|---|
| 9411 | 9411 | Zipkin Server listen port for the HTTP API and web UI |
You can use the Zipkin UI at http://localhost:9411/zipkin to browse the distributed traces collected from deployed streaming applications.
Postgres Instead of MySQL
The docker-compose-postgres.yml file configures using PostgreSQL instead of MySQL for both Spring Cloud Data Flow and SKipper. It disables the default mysql service, adds a new postgres service, and overrides the Data Flow and Skipper configurations to use postgres service:
wget -O docker-compose-postgres.yml https://raw.githubusercontent.com/spring-cloud/spring-cloud-dataflow/v2.8.4/src/docker-compose/docker-compose-postgres.yml
docker-compose -f ./docker-compose.yml -f ./docker-compose-postgres.yml upcurl https://raw.githubusercontent.com/spring-cloud/spring-cloud-dataflow/v2.8.4/src/docker-compose/docker-compose-postgres.yml -o docker-compose-postgres.yml
docker-compose -f .\docker-compose.yml -f .\docker-compose-postgres.yml upThe docker-compose-postgres.yml configurations expose the following container ports to the host machine:
| Host ports | Container ports | Description |
|---|---|---|
| 5432 | 5432 | PostgreSql DB server port. Use jdbc:postgresql://localhost:5432/dataflow to connect to the DB from your local machine |
RabbitMQ Instead of Kafka
The docker-compose-rabbitmq.yml configures RabbitMQ (instead of Kafka) as the message broker. It disables the default kafka and zookeeper services, adds a new rabbitmq service, and overrides the service binder configuration of the dataflow-server to RabbitMQ (for example, spring.cloud.dataflow.applicationProperties.stream.spring.rabbitmq.host=rabbitmq). Finally, it overrides the app-import service to register the RabbitMQ apps:
wget -O docker-compose-rabbitmq.yml https://raw.githubusercontent.com/spring-cloud/spring-cloud-dataflow/v2.8.4/src/docker-compose/docker-compose-rabbitmq.yml
docker-compose -f ./docker-compose.yml -f ./docker-compose-rabbitmq.yml upcurl https://raw.githubusercontent.com/spring-cloud/spring-cloud-dataflow/v2.8.4/src/docker-compose/docker-compose-rabbitmq.yml -o docker-compose-rabbitmq.yml
docker-compose -f .\docker-compose.yml -f .\docker-compose-rabbitmq.yml upDebugging
The following sections explain how to debug the DataFlow (or Skipper) server and the Stream Applications deployed by them.
In the debug configurations shown here fail to run, use the local machine IP address rather than the localhost name.
Debug Stream Applications
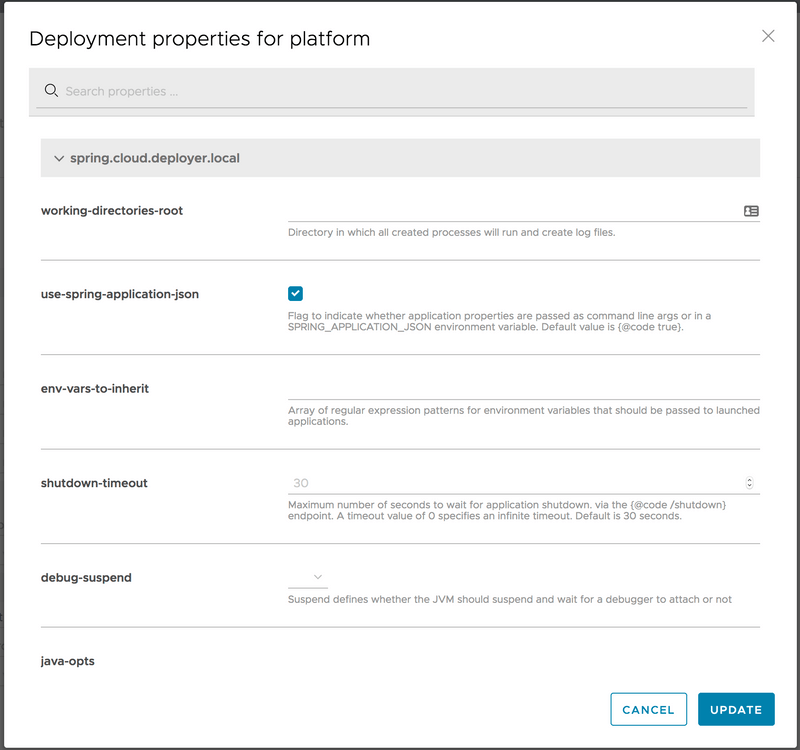
When deploying the stream to debug a Stream Applications, set the application deployment property (deployer.20000 - 20105 range. You can do it directly form the deployment UI panel. The following example sets debugPort to 20075:

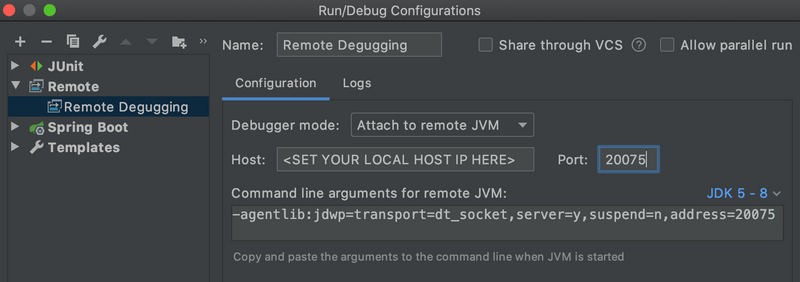
Open the stream application project in your IDE. Then configure a Remote Debug configuration by setting the Host: to the IP address of your local machine and set the Port: to the value used in the deployment property above.

You must use the IP address rather than localhost.
Debug Data Flow Server
The docker-compose-debug-dataflow.yml file enables remote debugging of the Data Flow Server. To enable the debugging, run:
wget -O docker-compose-debug-dataflow.yml https://raw.githubusercontent.com/spring-cloud/spring-cloud-dataflow/v2.8.4/src/docker-compose/docker-compose-debug-dataflow.yml
docker-compose -f ./docker-compose.yml -f ./docker-compose-debug-dataflow.yml upcurl https://raw.githubusercontent.com/spring-cloud/spring-cloud-dataflow/v2.8.4/src/docker-compose/docker-compose-debug-dataflow.yml -o docker-compose-debug-dataflow.yml
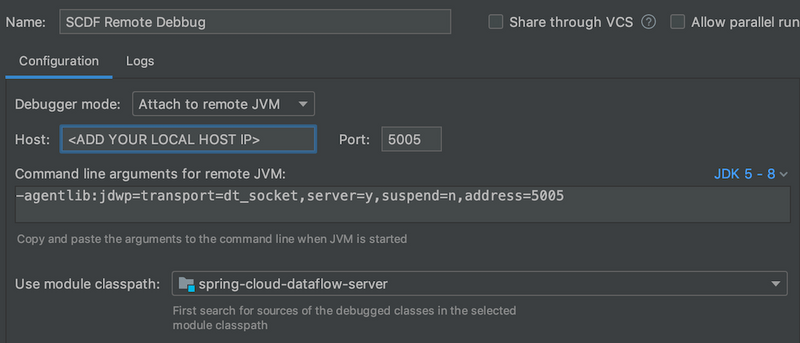
docker-compose -f .\docker-compose.yml -f .\docker-compose-debug-dataflow.yml upThe dataflow-server service waits for a debugger to connect on port 5005 to start debugging. The following screenshot shows how to configure remote debug with IntelliJ. Set the Host: with the IP address of your local machine. Do not use localhost, as it does not work inside the docker containers.

Often, while debugging, you need to build a new local spring-cloud-dataflow-server:latest Docker image. You can achieve this by running the following commands from the DataFlow root directory:
./mvnw clean install -DskipTests
./mvnw docker:build -pl spring-cloud-dataflow-server
Debug Skipper Server
Similarly, you can use the docker-compose-debug-skipper.yml file to enable remote debugging of the Skipper Server:
wget -O docker-compose-debug-skipper.yml https://raw.githubusercontent.com/spring-cloud/spring-cloud-dataflow/v2.8.4/src/docker-compose/docker-compose-debug-skipper.yml
docker-compose -f ./docker-compose.yml -f ./docker-compose-debug-skipper.yml upcurl https://raw.githubusercontent.com/spring-cloud/spring-cloud-dataflow/v2.8.4/src/docker-compose/docker-compose-debug-skipper.yml -o docker-compose-debug-skipper.yml
docker-compose -f .\docker-compose.yml -f .\docker-compose-debug-skipper.yml upThe skipper service waits for a debugger to connect on port 6006.
Integration Testing
The self-documented DataFlowIT.java class demonstrates how to reuse the same docker-compose files to build DataFlow integration and smoke tests.
Multi-platform Support
This configuration connects your local Skipper server to a remote platform (such as Kubernetes or Cloud Foundry) and lets you deploy streaming data pipelines on those platforms. As a prerequisite, it expects the Apache Kafka (or RabbitMQ) binder provisioned on the remote platform.
The Task and Batch applications require direct database access. However, because the Data Flow server and Database run locally, you can start Task application only on your local platform.
Also, because the Scheduler service is not supported by by the Local Deployer, it is also not supported by the docker-compose configuration.
The docker-compose-cf.yml file adds a remote Cloud Foundry account as a Data Flow runtime platform under the name of cf. You need to edit the docker-compose-cf.yml to add your CF API URL and access credentials.
wget -O docker-compose-rabbitmq.yml https://raw.githubusercontent.com/spring-cloud/spring-cloud-dataflow/v2.8.4/src/docker-compose/docker-compose-rabbitmq.yml
wget -O docker-compose-cf.yml https://raw.githubusercontent.com/spring-cloud/spring-cloud-dataflow/v2.8.4/src/docker-compose/docker-compose-cf.yml
docker-compose -f ./docker-compose.yml -f ./docker-compose-rabbitmq.yml -f ./docker-compose-cf.yml up
Because Kafka is not supported on CF, you also need to switch to Rabbit by using the docker-compose-rabbitmq.yml file. The docker-compose-cf.yml file expects a rabbit service to be configured in the target CF environment.
The docker-compose-k8s.yml file adds a remote Kubernetes account as a Data Flow runtime platform under the name of k8s. You need to edit the docker-compose-k8s.yml to add your Kubernetes master URL and access credentials.
wget -O docker-compose-k8s.yml https://raw.githubusercontent.com/spring-cloud/spring-cloud-dataflow/v2.8.4/src/docker-compose/docker-compose-k8s.yml
STREAM_APPS_URI=https://dataflow.spring.io/kafka-docker-latest docker-compose -f ./docker-compose.yml -f ./docker-compose-k8s.yml up
You cannot deploy the default Maven-based app starters in a Kubernetes environment. You can switch to the Docker-based app distribution by setting the STREAM_APPS_URI variable.
The docker-compose-k8s.yml expects a kafka-broker service to be pre-deployed in the target Kubernetes environment. Follow the choose a message broker instructions to deploy a kafka-broker service.