Autoscaling with Prometheus, Alertmanager and SCDF Scale API
To learn about the basic scaling concepts in Spring Cloud Data Flow, please consult the Scaling guide.
Overview
The solution leverages the Prometheus Alert Rules for defining scale-out and scale-in alerts based on application throughput metrics. The alerts are managed by the Prometheus AlertManager and a custom webhook, which in turn triggers the Scale API calls in SCDF.
For a streaming data pipeline:time | transform | log, we will show how to measure the throughput rates between the time and the transform applications, so we can use that as the deciding factor for alerts. When the defined threshold exceeds the set rules, we will discuss how the alerts are triggered and likewise the autoscale calls are triggered.
Following pseudocode illustrates the logic of such alert rules:
rateDifference = rate(time) - rate(transform)
if rateDifference > 500 for 1 minute do fire HighThroughputDifference
if rateDifference == 0 for 3 minutes do fire ZeroThroughputDifference - Query expression that computes, in real-time, the throughput (e.g. rate) difference between the
timeandtransformapplications. -
HighThroughputDifferencealert rule that fires when the rate difference exceed500 msg/sfor the duration of1 min. -
ZeroThroughputDifferencealert rule that fires if the rate difference stays0 msg/sfor at least3 min.
Following diagram shows the high level architecture.
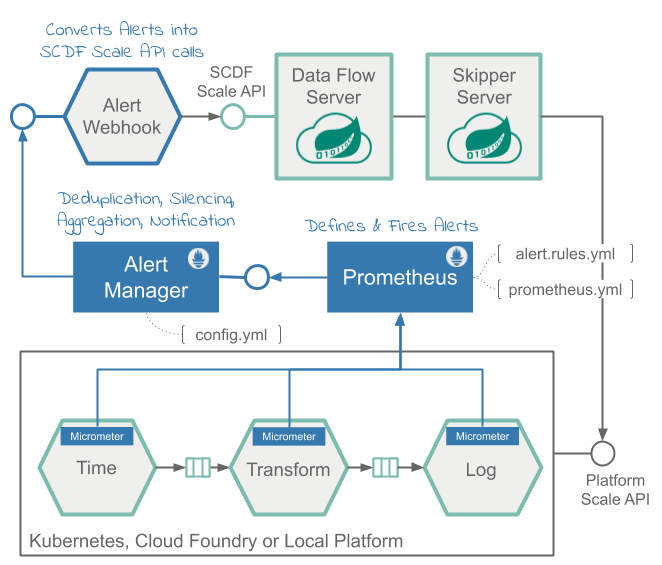
The Data Flow metrics architecture is designed with the help of the Micrometer library. Prometheus can be one of the monitoring backends that can collect various application metrics for performance analysis, and it allows for alert configurations, as well.
The alerting in Prometheus is divided into:
Alert Rules- defined inside and triggered by the Prometheus service.Alertmanager- a standalone service that receives and manages the fired alerts and in turn sends out notifications to a pre-registered webhooks.
The Alert Rules are based on the Prometheus Expression Language (PQL).
They are used to define and send the scale alerts to Alertmanager.
For example the scale-out alert rule definition looks something like this:
alert: HighThroughputDifference
expr:  avg(irate(spring_integration_send_seconds_count{application_name="time"}[1m])) by(stream_name) -
       avg(irate(spring_integration_send_seconds_count{application_name="transform"}[1m])) by(stream_name) > 500
for: 30s
Check alert.rule.yml (and here for the kubectl installation) to see the used alert rules definitions.
The spring_integration_send_seconds_count metrics comes from the spring integration micrometer support and is used for computing the message rate.
The Alertmanager is a standalone service that manages the alerts, including silencing, inhibition, aggregation and sending out notifications to pre-configured webhooks.
The AlertWebHookApplication (part of the scdf-alert-webhook Spring Boot app) is a custom Spring Boot application, registered as a Alertmanager Webhook Receiver via the config.yml.
The AlertWebHookApplication receives the alert notifications (in JSON format) from Prometheus. With the help of SCDF's Scale API, it can then trigger the scale-out request to autoscale the referred by the alert streaming data pipelines in SCDF.
The alert notifications contain also the metrics labels used in the alert PQL expressions.
For our example that means that the stream_name label is passed along with the notifications alerts allowing the AlertWebHookApplication to determine the name of the data pipeline that has to be scaled.
The Data Flow Scale REST API provides a platform agnostic mechanism for scaling data pipeline applications.
The AlertWebHookApplication uses the spring.cloud.dataflow.client.server-uri property to configure the Scale API endpoint. Check alertwebhook-deployment.yaml for the entire deployment configuration.
Following video animation illustrates the Data Flow auto-scaling flow:
Prerequisite
This recipe uses the Kubernetes platform.
The recipes is successfully tested on GKE cluster with 5 nodes.
The high CPU requirements due to the multiple app instances would make it difficult or imposable to run the recipe on minikube.
- Follow the Kubectl installation instructions to setup Spring Cloud Data Flow with Kafka broker.
-
Then install the
Alertmanagerand theAlertWebHookand reconfigure thePrometheusservices:kubectl apply -f https://raw.githubusercontent.com/spring-cloud/spring-cloud-dataflow-samples/master/dataflow-website/recipes/scaling/kubernetes/alertwebhook/alertwebhook-svc.yaml kubectl apply -f https://raw.githubusercontent.com/spring-cloud/spring-cloud-dataflow-samples/master/dataflow-website/recipes/scaling/kubernetes/alertwebhook/alertwebhook-deployment.yaml kubectl apply -f https://raw.githubusercontent.com/spring-cloud/spring-cloud-dataflow-samples/master/dataflow-website/recipes/scaling/kubernetes/alertmanager/prometheus-alertmanager-service.yaml kubectl apply -f https://raw.githubusercontent.com/spring-cloud/spring-cloud-dataflow-samples/master/dataflow-website/recipes/scaling/kubernetes/alertmanager/prometheus-alertmanager-deployment.yaml kubectl apply -f https://raw.githubusercontent.com/spring-cloud/spring-cloud-dataflow-samples/master/dataflow-website/recipes/scaling/kubernetes/alertmanager/prometheus-alertmanager-configmap.yaml wget https://raw.githubusercontent.com/spring-cloud/spring-cloud-dataflow-samples/master/dataflow-website/recipes/scaling/kubernetes/prometheus/prometheus-configmap.yaml kubectl patch cm my-release-prometheus-server --patch "$(cat ./prometheus-configmap.yaml)" kubectl delete pods -l app=prometheus
-
Follow the Helm installation instructions to setup Spring Cloud Data Flow with Kafka broker. You can use
features.monitoring.enabled=truewith at least10Gistorage space:helm install --name my-release stable/spring-cloud-data-flow --set features.monitoring.enabled=true,kafka.enabled=true,rabbitmq.enabled=false,kafka.persistence.size=10Gi -
Then install the
Alertmanagerand theAlertWebHookand reconfigure thePrometheusservices:kubectl apply -f https://raw.githubusercontent.com/spring-cloud/spring-cloud-dataflow-samples/master/dataflow-website/recipes/scaling/kubernetes/helm/alertwebhook/alertwebhook-svc.yaml kubectl apply -f https://raw.githubusercontent.com/spring-cloud/spring-cloud-dataflow-samples/master/dataflow-website/recipes/scaling/kubernetes/helm/alertwebhook/alertwebhook-deployment.yaml kubectl apply -f https://raw.githubusercontent.com/spring-cloud/spring-cloud-dataflow-samples/master/dataflow-website/recipes/scaling/kubernetes/alertmanager/prometheus-alertmanager-service.yaml kubectl apply -f https://raw.githubusercontent.com/spring-cloud/spring-cloud-dataflow-samples/master/dataflow-website/recipes/scaling/kubernetes/alertmanager/prometheus-alertmanager-deployment.yaml kubectl apply -f https://raw.githubusercontent.com/spring-cloud/spring-cloud-dataflow-samples/master/dataflow-website/recipes/scaling/kubernetes/alertmanager/prometheus-alertmanager-configmap.yaml wget https://raw.githubusercontent.com/spring-cloud/spring-cloud-dataflow-samples/master/dataflow-website/recipes/scaling/kubernetes/helm/prometheus/prometheus-configmap.yaml kubectl patch cm my-release-prometheus-server --patch "$(cat ./prometheus-configmap.yaml)"
Register latest kafka-docker app starters:
app import --uri https://dataflow.spring.io/kafka-docker-latestStart a SCDF Shell and connect it to your Data Flow Server:
server-unknown:>dataflow config server http://<SCDF IP>Autoscaling Recipe
Create data pipeline
stream create --name scaletest --definition "time --fixed-delay=995 --time-unit=MILLISECONDS | transform --expression=\"payload + '-' + T(java.lang.Math).exp(700)\" | log"The time source generates current timestamp messages on a fixed time-interval (995ms = ~1 msg/s), the transform processor performs a math operation to simulate a high CPU processing, and the log sink prints the transformed message payload.
Deploy data pipeline with data partitioning
stream deploy --name scaletest --properties "app.time.producer.partitionKeyExpression=payload,app.transform.spring.cloud.stream.kafka.binder.autoAddPartitions=true,app.transform.spring.cloud.stream.kafka.binder.minPartitionCount=4"The producer.partitionKeyExpression=payload property configures time’s output binding for partitioning. The partition key expression uses the message payload (e.g. the toString() value of the current timestamp) to compute how the data needs to be partitioned to the downstream output channels.
The spring.cloud.stream.kafka.binder.autoAddPartitions deployment property instructs the Kafka binder to create new partitions when required. This is required if the topic is not already over-partitioned.
The spring.cloud.stream.kafka.binder.minPartitionCount property sets the minimum number of partitions that the Kafka binder configures on the topic, which is where the transform-processor is subscribing for new data.
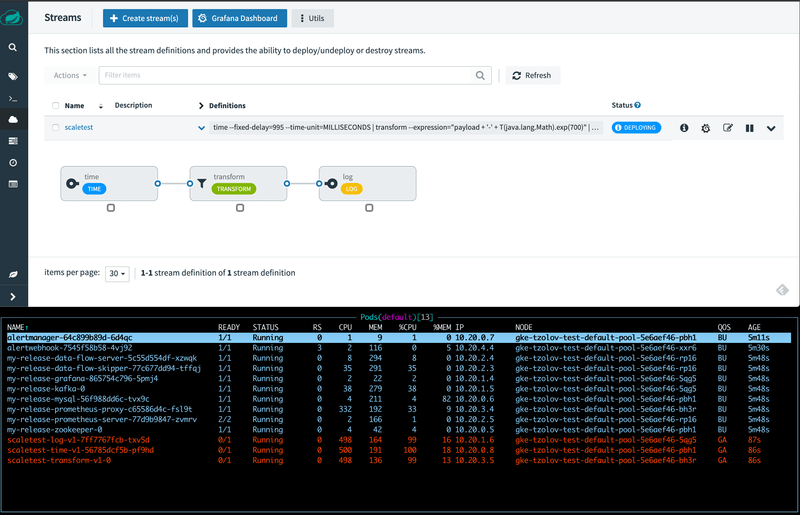
Use the SCDF's built-in Grafana dashboard to review the stream application's throughput and the other application metrics:

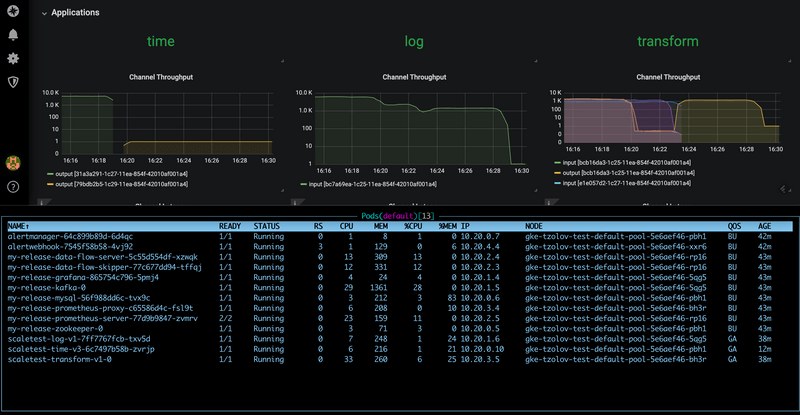
The time, transform and log applications maintain the same message throughput (~1 msg/s). The transform copes fine with the current load.
Increase data pipeline load
Now, let's increase the load by increasing the time-source's message production rate. By changing time's time-unit property from MILLISECONDS to MICROSECONDS the input rate will increase from one to a couple of thousands of messages per second.
Note that the stream rolling-update functionality allows to rolling-update the time application without stopping the entire stream:
stream update --name scaletest --properties "app.time.trigger.time-unit=MICROSECONDS"The time app is re-deployed with the new time-unit property:

Now time source emits messages with a rate of ~5000 msg/s. The transform processor, though, is capped at around 1000 msg/s and that in turn, it halts the throughput of the entire stream to a certain level. This is an indicator that the transform has become the bottleneck.

The HighThroughputDifference Prometheus alert rule detects the rate discrepancy and fires a scale-out alert:

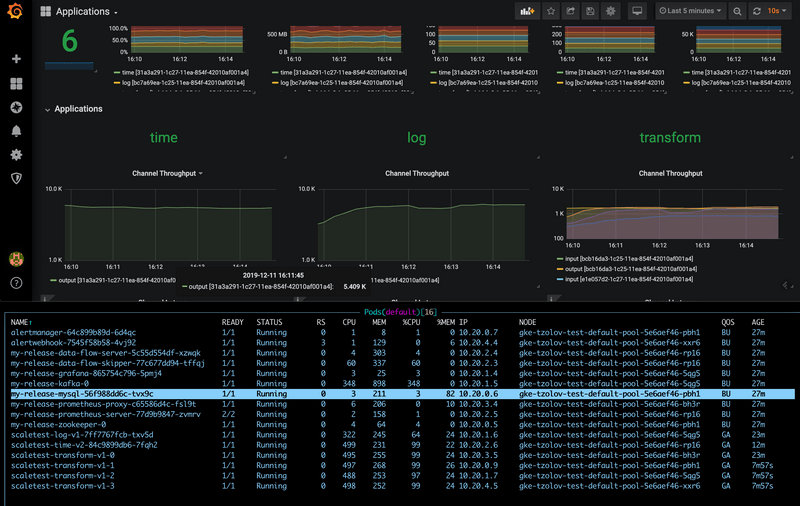
in result 3 additional transform instances are added:
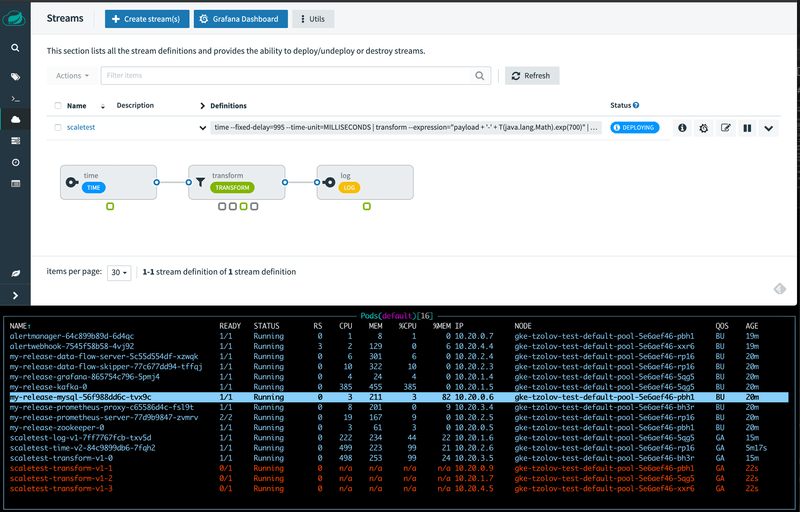
with the help of the additional instances of the log sink the entire data pipeline catches up to match with the time source's production rate:
Reduce data pipeline load
If we reduce the source's data production rate back to the original rate (i.e., 1 msg/s):
stream update --name scaletest --properties "app.time.trigger.time-unit=MILLISECONDS"The extra transform processor instances aren't altering the overall throughput rate anymore.
Eventually the rate difference becomes zero and the ZeroThroughputDifference alert is fired. The alert in turn triggers a scale-in action and the extra instances can be scaled back in:

With a single transform instance the throughput of the entire data pipeline is normalized back to ~1 msg/s :
